

Integrated monitoring.
No extra costs.
No extra costs.
Complete observability, integrated from day one
Integrated observability with logs, metrics, and alerts. No external tools, no agent setup, just complete visibility.
Centralized Logs
All application and infrastructure logs in one place. Advanced filtering, full-text search, and up to 90 days retention. Find issues in seconds, not hours.
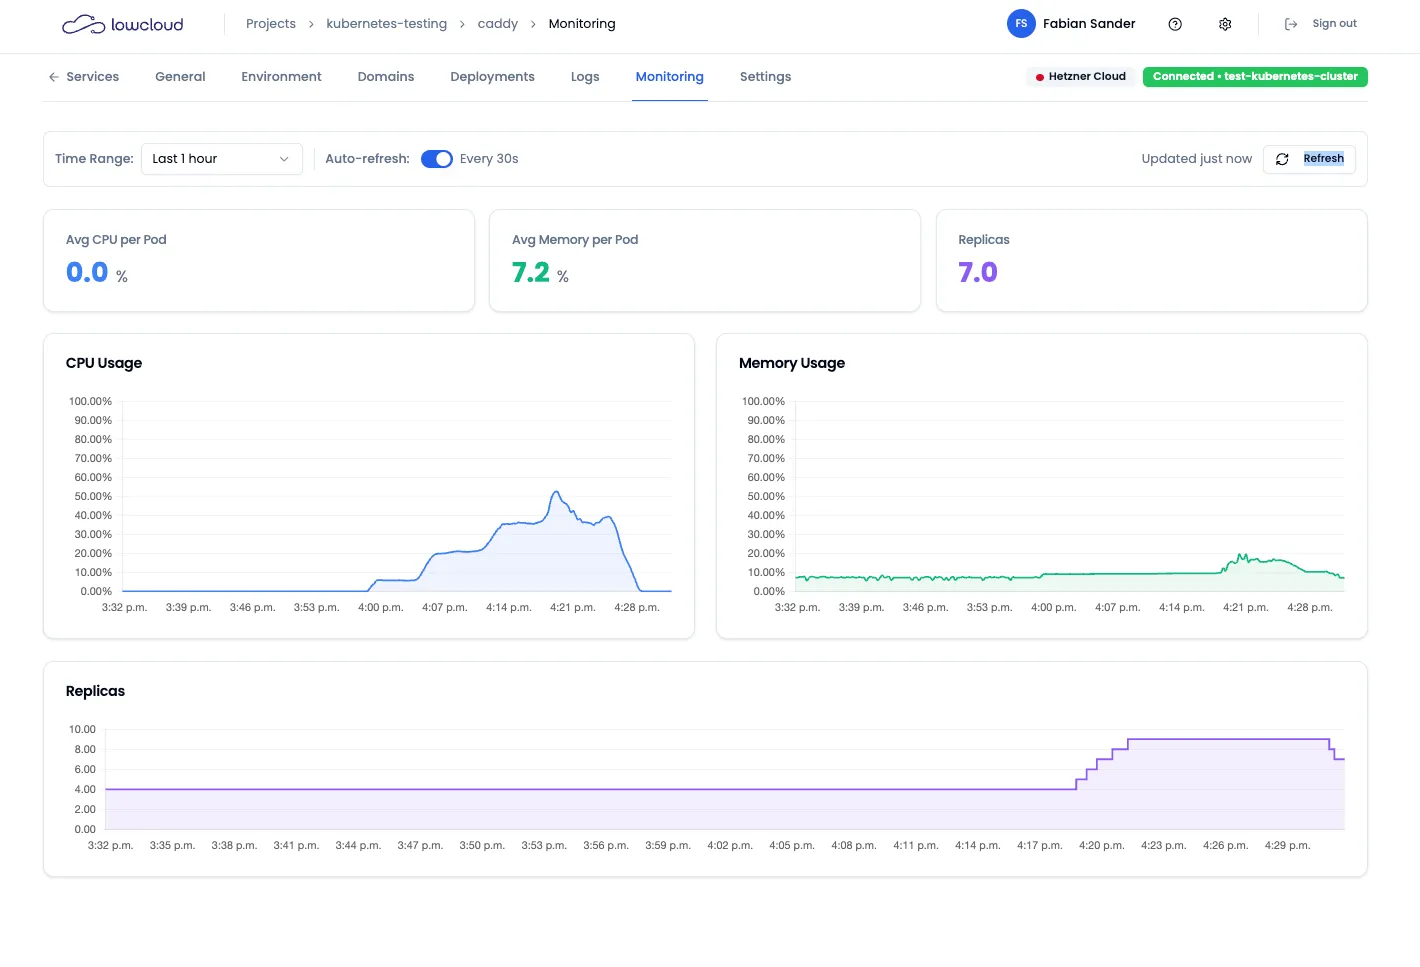
Real-Time Metrics
Track CPU, memory, disk, and network usage live and historically. Performance insights for every service, database, and infrastructure component.
Health Monitoring
Automatic health checks for all services. Clear troubleshooting guidance in developer-friendly language. Know what's wrong and how to fix it.
Everything you need to stay on top of your systems
Built-in observability features that eliminate external monitoring tools
Application & Infrastructure Logs
Centralized logging for all services and infrastructure. Filter by service, time range, or log level. Full-text search across millions of log lines. 90-day retention included.
Performance Metrics
Real-time metrics for CPU, memory, disk, and network. Historical data for trend analysis. Custom dashboards for your most important metrics. No agent installation required.
Health Status & Alerts
Automatic health checks monitor every service. Get alerted when performance degrades or errors spike. Clear guidance on what went wrong and how to fix it.
Log Correlation
Automatically correlate logs with deployments, metrics, and events. See exactly what happened before an incident. Jump from metrics to logs with one click.
Developer-Friendly Insights
No complex dashboards or ops jargon. Clear insights in language developers understand. Actionable recommendations, not just data dumps.
What makes lowcloud monitoring different
Integrated observability without the complexity and cost of external tools
No External Tools Required
Everything integrated in lowcloud. No Datadog, no New Relic, no separate monitoring stack. One platform for deploy, infrastructure, and monitoring.
Data Sovereignty
All logs and metrics stay on sovereign infrastructure in Germany. No data leaves the EU. GDPR-compliant monitoring without configuration.
Developer-Friendly Interface
Forget complex dashboards and infrastructure jargon. Clear insights in developer language. Focus on fixing issues, not decoding metrics.
Open Standards
Built on Prometheus, Loki, and Grafana. No proprietary formats or vendor lock-in. Export data anytime, use standard tooling if needed.
Zero Configuration
Monitoring activates automatically with every deployment. No agents to install, no configuration files, no manual setup. Just works from day one.
Cost-Effective
No per-GB pricing like external tools. Monitoring included in platform fee. Scale without surprise monitoring bills. Predictable costs, complete visibility.
Frequently asked questions
Common questions about lowcloud monitoring
Logs are retained for 90 days by default. You can configure longer retention periods if needed. All logs stay on sovereign infrastructure in Germany and never leave the EU.
We collect CPU, memory, disk, and network metrics for all services and infrastructure. Application-specific metrics (response times, error rates) are also tracked. Custom metrics can be added via standard Prometheus format.
Yes. You can create custom dashboards with the metrics that matter to your team. Use our built-in dashboard builder or connect directly to Grafana for advanced customization.
No. All monitoring data (logs, metrics, traces) stays on sovereign infrastructure in Germany. Your data never leaves the EU.
Alerts are triggered automatically when health checks fail or metrics exceed thresholds. You get notified via email, Slack, or webhook. Each alert includes clear guidance on what's wrong and suggested fixes.
Yes. Export logs in standard formats (JSON, CSV) or connect directly to our Loki and Prometheus endpoints. No vendor lock-in, your data is always accessible.
Ready for complete visibility?
Monitor everything in one place. No external tools, no complexity.