

Kubernetes Monitoring: Using Logs and Metrics Effectively
A Kubernetes cluster is running, deployments are green, and yet problems arise that nobody catches early enough. The reason is usually not faulty code but missing or poorly configured Kubernetes monitoring. If you don't know what's happening inside your pods, you're flying blind — reacting to outages instead of predicting them. This article shows how logs and metrics work together, where they differ, and what a solid monitoring stack needs to deliver in practice.
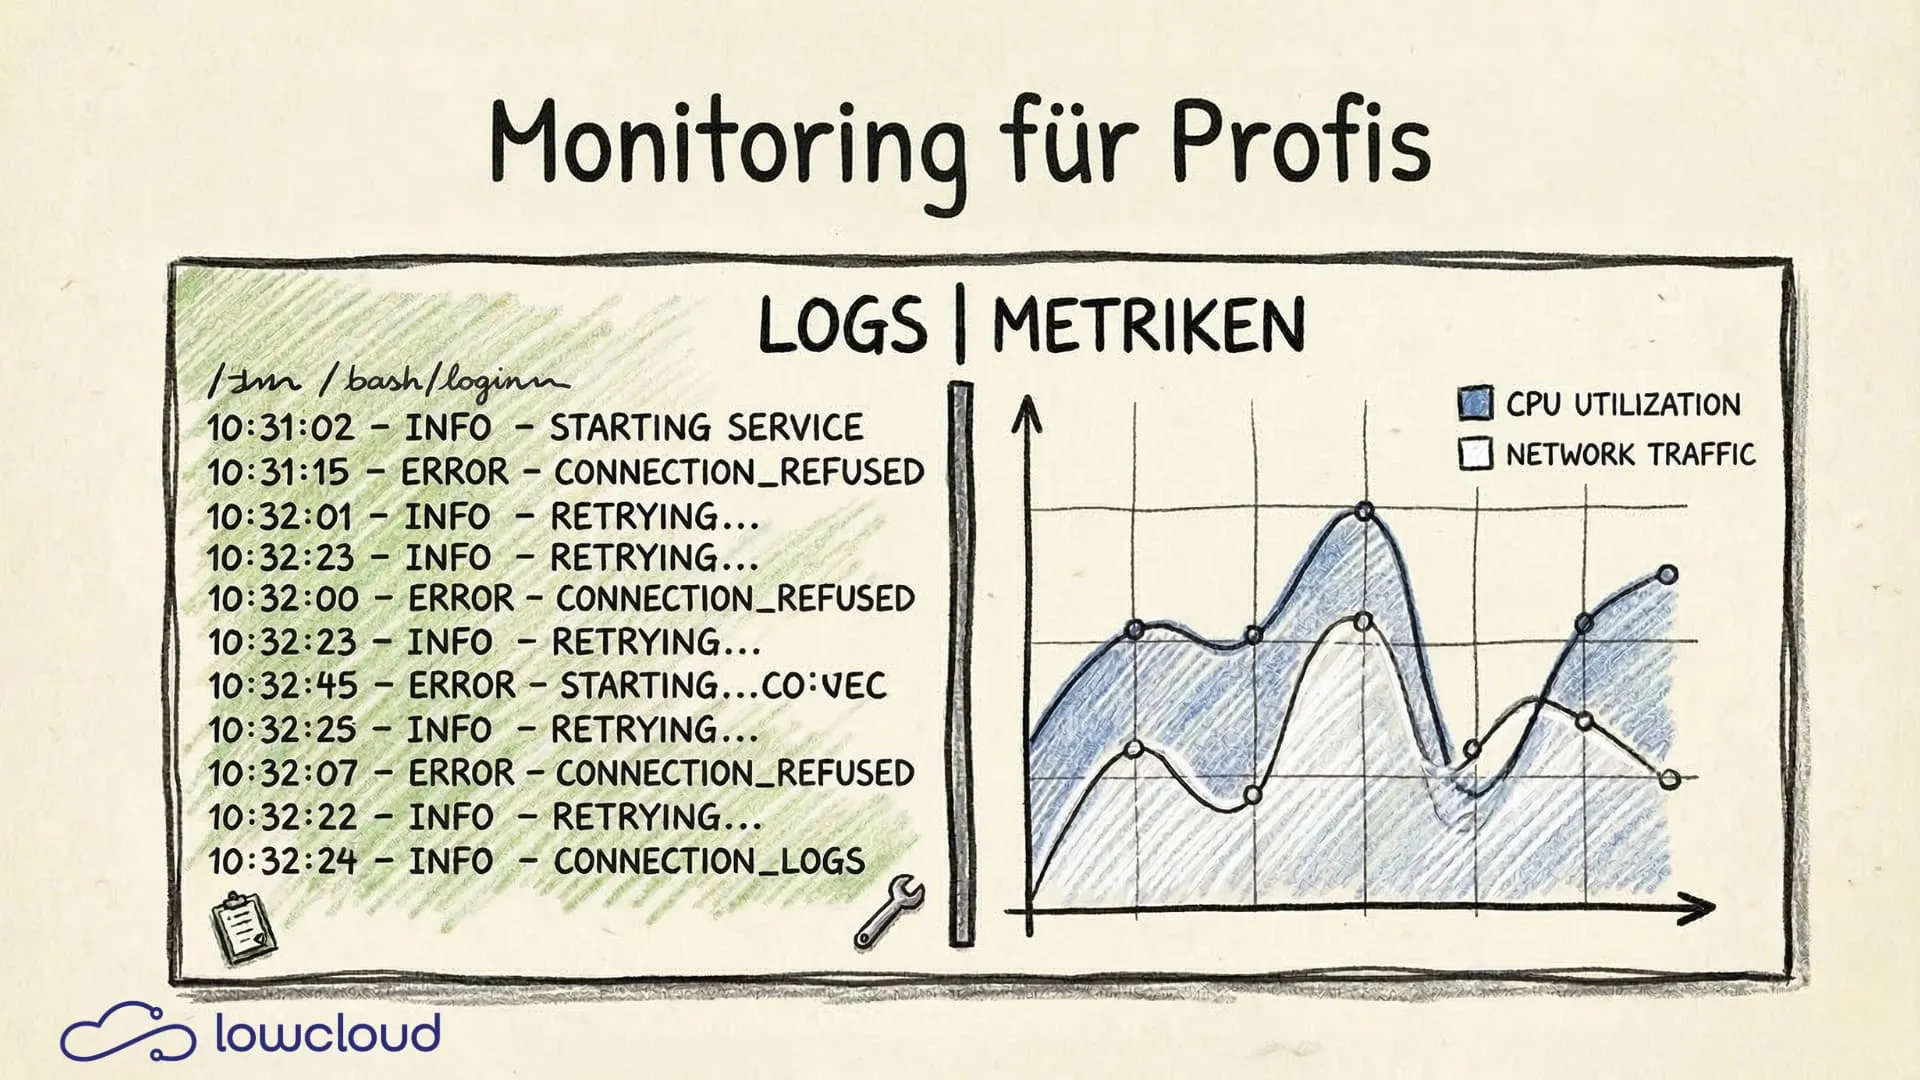
Logs vs. Metrics: Two Tools, Two Jobs
Logs and metrics are often mentioned in the same breath, but they solve different problems.
Metrics are numerical time-series data: CPU utilization, memory consumption, request rate, error rate. They're well suited for spotting trends, monitoring thresholds, and detecting anomalies quickly. Metrics are compact and can be aggregated efficiently.
Logs, on the other hand, are event-based text messages. They contain the context that metrics lack: Which user triggered which request? What error occurred on which line? What exactly happened before the application crashed?
The simple rule of thumb: Metrics tell you that something is wrong. Logs tell you why.
If you only have metrics, you see the alert but not the cause. If you only have logs, you drown in text and can't find patterns. Both together paint the full picture.
The Three Pillars of Observability
Observability is more than just monitoring. The term describes the ability to understand a system's internal state from its outputs. In practice, this rests on three pillars:
- Metrics — aggregated numbers over time
- Logs — structured or unstructured event records
- Traces — distributed tracing across multiple services
Kubernetes monitoring primarily covers the first two pillars. Tracing comes into play once multiple microservices communicate with each other and you need to understand which service in a request chain took how long.
For most teams, the pragmatic starting point is: get metrics and logs under control first, add tracing later as microservice complexity grows — or when AI agent workloads bring their own observability requirements.
Kubernetes Monitoring with Prometheus
Prometheus is the de facto standard for metrics in Kubernetes environments. The principle is simple: Prometheus scrapes HTTP endpoints (/metrics) at defined intervals and stores the data as time series in its own database.
Two components provide the bulk of Kubernetes metrics:
node_exporter— hardware and OS metrics from the node: CPU, RAM, disk I/O, networkkube-state-metrics— Kubernetes-specific metrics: pod status, deployment replicas, job successes, resource requests vs. limits
On top of that come application-specific metrics. If you're running a Go or Java application, you can expose custom metrics using a Prometheus library: request latencies, queue sizes, business metrics.
Label Cardinality: The Underestimated Performance Problem
Prometheus metrics are qualified by labels. This is powerful but can get expensive. If you use a user ID or session ID as a label, the number of time series explodes. Thousands or millions of distinct label values mean thousands or millions of separate time series — memory consumption and query performance suffer significantly.
The rule: labels should have a manageable, bounded set of possible values. Status code (200, 404, 500), HTTP method (GET, POST), service name — these are sensible labels. User IDs or request IDs belong in logs, not in metrics.
Log Aggregation in Kubernetes
kubectl logs <pod> is fine for development. In production, it's a crutch.
Pods can be restarted at any time, and their old logs disappear with them. When a pod crashes and restarts, you lose exactly the logs you'd need for root cause analysis. On top of that, manual log queries don't scale across many pods.
The solution is log aggregation: all logs are collected by a log collector (e.g., Fluent Bit or Fluentd), forwarded, and stored centrally.
For central storage, there are two common options:
- Loki (by Grafana Labs): lightweight, indexes only metadata (labels), stores log content compressed. Well integrated with Grafana, significantly cheaper to operate than Elasticsearch.
- Elasticsearch: powerful full-text index, more complex queries possible, but more resource-intensive and operationally demanding.
For most Kubernetes teams already using Grafana, Loki is the natural choice. Elasticsearch makes sense when complex full-text search or advanced analytics are needed.
Log Level Discipline in Production
A frequent source of problems: applications running in production with log level DEBUG. The result is gigabytes of logs per day that nobody reads, but that cost storage and make finding real errors harder.
Clear conventions:
- DEBUG — development only, or for targeted troubleshooting
- INFO — important events that document normal operations
- WARN — something unexpected happened, operations continue
- ERROR — a failure occurred that needs attention
And: structured logging is always preferable to unstructured logging. Writing logs as JSON makes them efficient to filter and query in Loki or Elasticsearch. Free-text logs are hard for machines to process.
Alerting: What Actually Deserves an Alert
An alert that nobody pays attention to anymore is worse than no alert at all. Alert fatigue is a real problem. Teams that receive dozens of notifications daily get used to them and eventually miss the critical one.
Prometheus Alertmanager is the standard tool for receiving, grouping, deduplicating, and routing alerts (Slack, PagerDuty, email, etc.).
Principles for effective alerting:
Alert on symptoms, not causes. An alert on "high CPU" is often useless. High CPU isn't a problem as long as the application is responding. Better: alert on response time > 2 seconds or error rate > 1%.
Use the four golden signals (from the Google SRE book): latency, traffic, errors, saturation. These are the signals that actually indicate user-facing problems.
Define alerting tiers. Not every alert needs to wake someone up at 3 AM. Critical alerts go to PagerDuty, warnings go to a Slack channel.
Test your alerts. An alert that has never fired may have never had the chance — or it might be broken.
Dashboards with Grafana
Grafana is the standard tool for visualizing Prometheus metrics and Loki logs. A good dashboard answers at a glance: Is everything okay?
What belongs on every team dashboard:
- Request rate — how many requests is the service handling right now?
- Error rate — how many of those are failing?
- Latency — P50, P95, P99 response times (not just averages)
- Pod status — are all replicas running, are there restarts?
- Resource utilization — CPU and memory vs. defined limits
A common mistake: dashboards that show too much. When 40 graphs are on one screen, nobody sees anything anymore. Less is more — a focused overview dashboard, with links to detail dashboards for specific analysis.
Grafana also offers annotations: when was a new deployment rolled out? These markers on graphs are enormously helpful for correlating performance changes with deployments.
Kubernetes Monitoring on a DevOps-as-a-Service Platform
Building and running your own monitoring stack is possible but labor-intensive. Prometheus, Alertmanager, Loki, Fluent Bit, Grafana: each component needs to be configured, secured, updated, and scaled. That's operational overhead that doesn't directly contribute to your product.
On a Kubernetes DaaS platform like lowcloud, monitoring infrastructure is part of the platform. This means: metrics for all workloads are collected automatically, logs are aggregated and made searchable, basic alerts are preconfigured. Teams can focus on configuring their own metrics and alerts instead of running the stack themselves.
This is especially relevant for smaller teams that handle DevOps on the side. Getting Kubernetes monitoring right takes time — time that can be invested in product development when the platform handles the fundamentals.
Teams running Kubernetes workloads on lowcloud get Prometheus and Grafana as integrated services — configurable, but without the initial infrastructure overhead. Learn more at lowcloud.de.
Monitoring isn't a one-time project you check off a list. It's an ongoing process: sharpening alerts, adjusting dashboards, instrumenting new services. Those who set up monitoring before migrating to Kubernetes have a clear advantage when incidents happen — and sleep better at night.
DevOps Tool Sprawl: How It Happens and How to Stop It
Tool sprawl costs more than licenses: cognitive load, slow onboarding, lost knowledge. Here is how to bring order to your DevOps setup.
OB7 Case Study: Website Deployment Without Infrastructure Overhead
How OB7 deploys their new website with lowcloud – no server configuration, SSL setup, or provider management. A case study on managed container deployments.